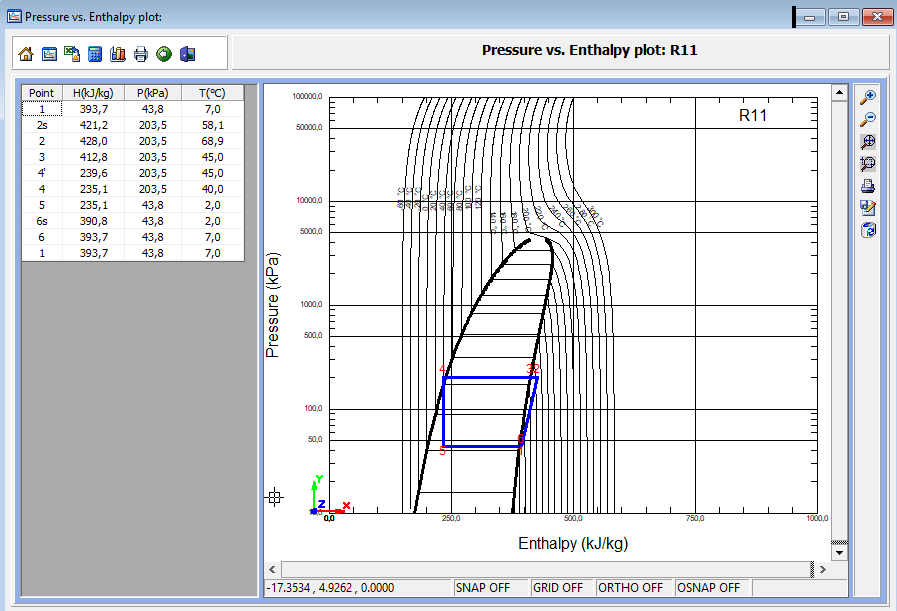
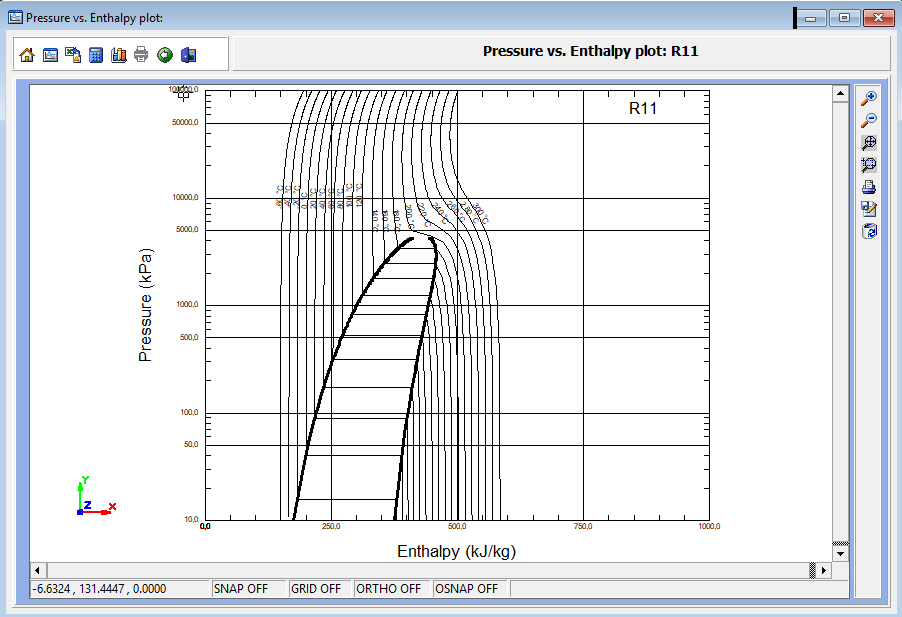
Pressure vs. Enthalpy plot

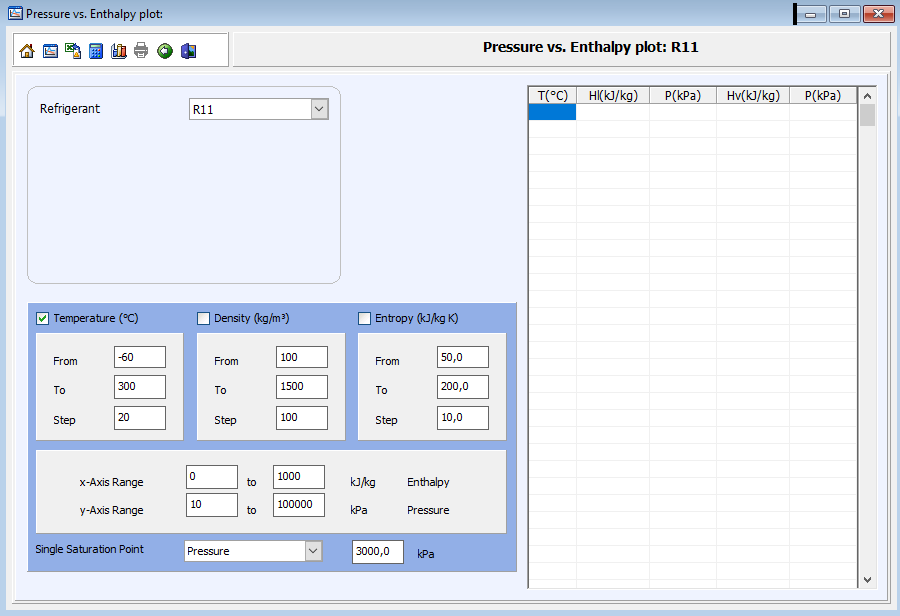
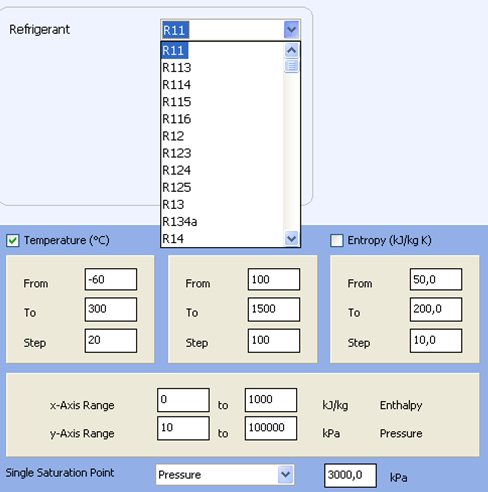
To start the chart we click on the 
By clicking  button, we can export the graph into an excel file
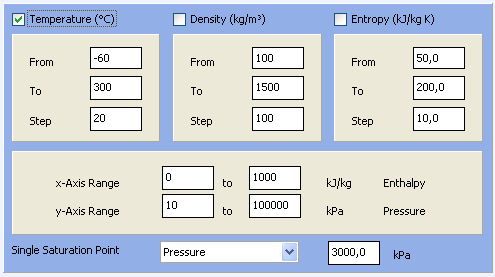
By clicking  button, we can calculate a single saturation point
By clicking on the  , we can do the cycle
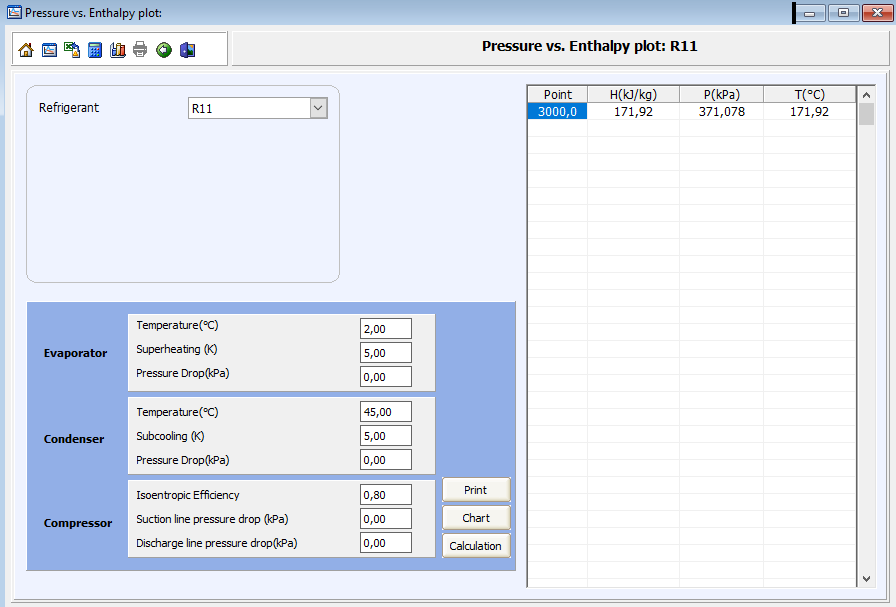
We click on the calculation button
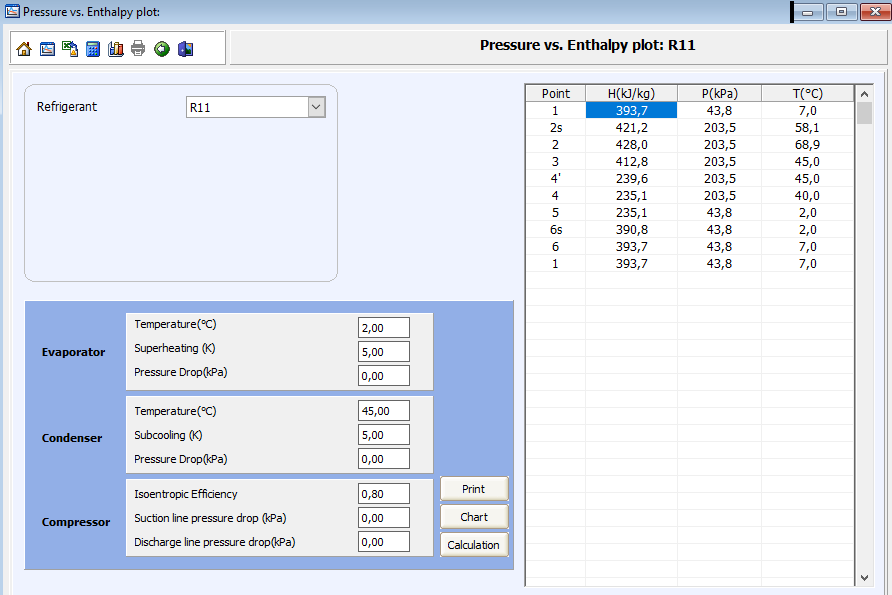
Now we click on the “Chart” button