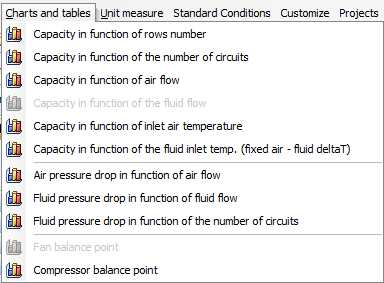
MENU "CHARTS AND TABLES"
MENU “CHARTS AND TABLES”
![]()
Let’s open the tab itself and select the first line
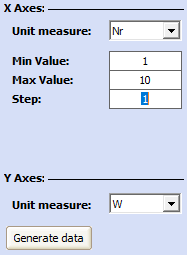
On the x axis, we should set the number of rows. We insert the Min value =1, Max Value =10 and Step: 1
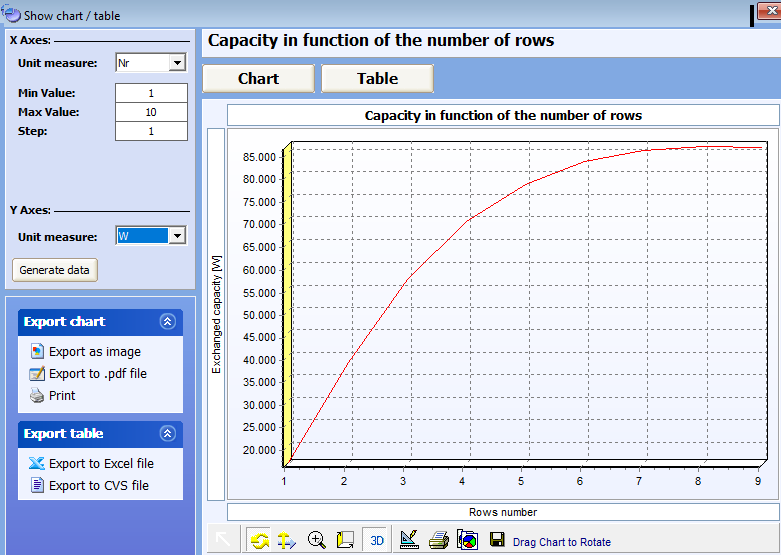
The graph shows that maximum productivity is achieved with a value of 7 rows. Details can be seen in the table:
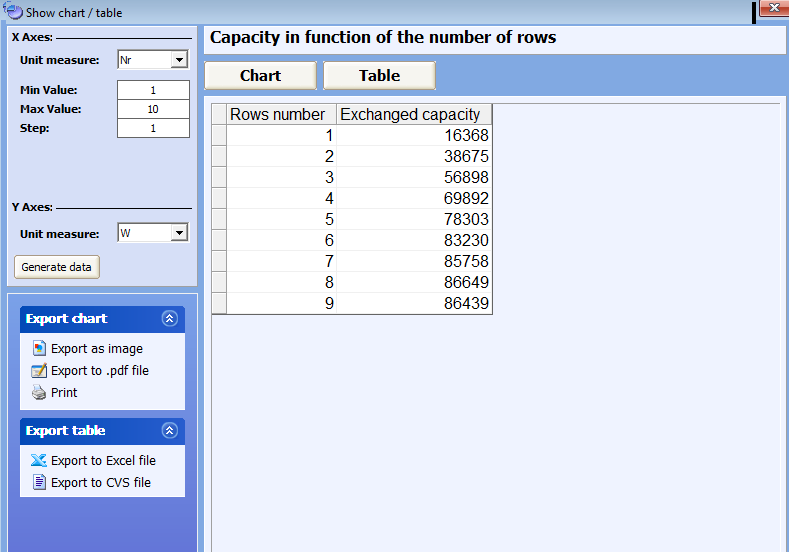
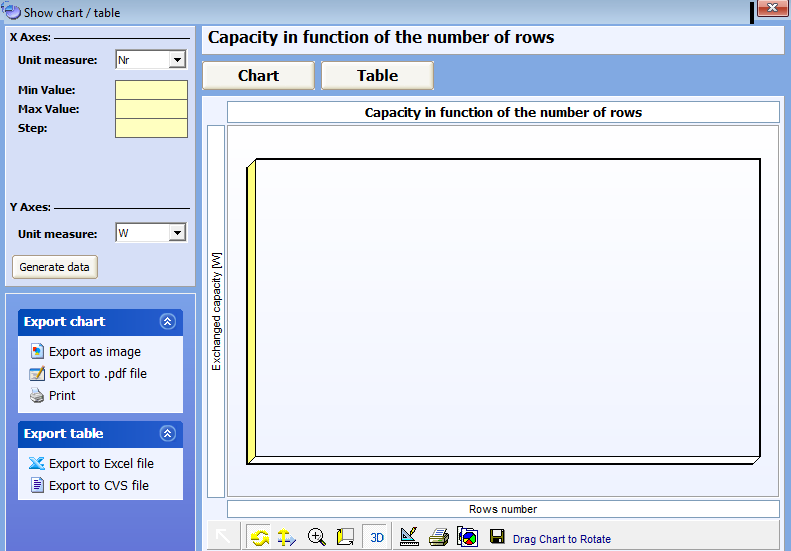
From the above image we see, that it’s possible to:
- Export and Save the chart as Image
- Export to .pdf file
- Print the chart

- Export the table to file excel
 or to cvs file
Using the same logic, other charts and graphs can be created.
The "Compressor Balance Point" chart will be considered separately in the present document.